
Let’s Compare: GP to BC Reporting and Analysis

One of my favorite things about Microsoft Dynamics ERP is the reporting, and the various needs, shapes and sizes it comes in. Given there are dramatic differences between how we report on Dynamics GP as compared to Business Central, I wanted to break it all down with similarities and comparisons. GP users have a lot to learn about reporting in BC. Hopefully this post aids in your journey and enhances your understanding of what to expect when moving to BC in the cloud. Please watch the Migration Station page for more in-depth, side-by-side report comparison analysis in the future as well.
To frame the length of this post, there is a LOT I can say about comparing BC to the reporting in GP. I’ve helped deploy complex SSRS reports as well as performed many Report Writer modifications to add aging buckets, other data fields, or create calculated values. Back in the day I mastered FRx, and subsequently immersed myself in and published a book on Management Reporter. Over the past number of years I’ve had the privilege of being on many ‘Ask the Experts’ sessions and ‘Reporting Shoot-Outs’ at user group events. I have even created and presented extensively on Power BI reporting for Dynamics GP, and have reports available for download on What’s New features, finding Bad Data, GP System Admin, and GP Security.
Naturally the Dynamics Mindset in me is kicking into high gear here, and it wants to know about all of the reporting capabilities in and around BC. It wants to now “What am I losing?” and “What am I getting? and “How will it work in the future” more than anything else. If that is also happening to you, then this post is probably perfect for you.
The real focus and end-result of this comparison analysis will be on how BC operates and what types of reporting it has to offer to suit the spectrum of reporting demands in your organization.
The Business Central Analytics Advantage over Dynamics GP
Before I get totally into the weeds with my thoughts, Microsoft published an article which I think is the cornerstone of their approach to “reporting” from a BC standpoint, and I wanted to highlight a few points from a GP perspective because I find it instructive and insightful while reframing your move to the cloud. Sure, BC has formal customer and vendor-facing documents, and reports of many varieties, but is also has baked-in analysis tools for the everyday user that impact their productivity and effectiveness.
This modern, cloud-based ERP will contain a lot of data, and information needs to flow to the right people in a way that has meaning for them. Data is collected, entered, integrated, actioned upon, and analyzed at so many different levels, it can be hard to keep track of it all. Each function in the organization has a prism thru which they need to aggregate or filter out what matters to their role or function. No hierarchical level is necessarily more important than another, because they all work together as an organization.

Can you think about all of the ways your GP users get their reports? As part of your implementation or migration to BC you should absolutely be cataloging them! But don’t start just yet - read on first.
For a GP user, the devil is in the details, and you need to know more about the exact tools, techniques, and approaches to reporting, and exactly how BC delivers on these essentials, especially without having direct access to SQL Server!
As you transition to BC however, you will ultimately find a companion for just about every staple GP report. You will also find a lot more flexible options that go above and beyond what you are used to. All of them can be delivered from, in or thru Business Central.
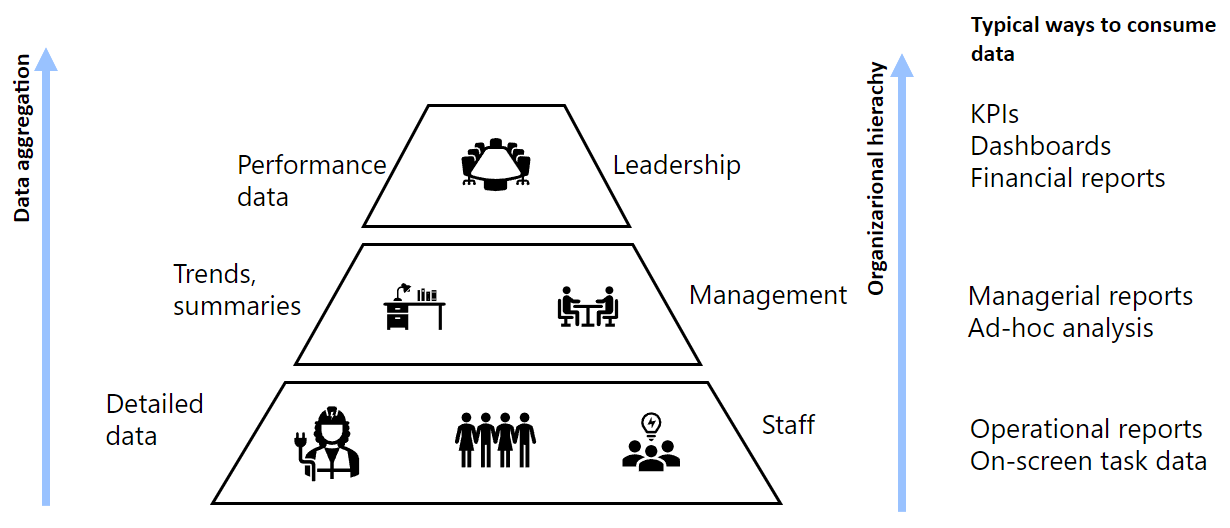
I have previously blogged about how GP SmartLists compare to BC List Pages. If you have not read that yet, start there. The bottom 2/3 of the reporting pyramid in each of these three diagrams is mostly covered by SmartLists/List Pages and the native, module-based reports. There are SO MANY of these module-specific reports now it can be perplexing (finally!!). I will be doing a separate post comparing these 1:1 from GP to BC, so watch for news on that over the coming months!
A lot of users rely on Excel-linked reports for GP, and there is a LOT of Excel-based reporting going on out there. BC does Excel well, but it does it differently than GP. A lot of managerial and ad-hoc reports rely on Excel-linked reports or embedded SQL queries, so there is going to be some adjustment as to how those work among your user base. I also intend to do some instructional posts about querying BC data using Power BI as well, so you can get familiar with alternative methods that could also be familiar, yet exciting, for you to know about.
Management Reporter users have new financial reporting options to explore. Natively, BC has your actuals/budgets, rows/columns/dimension sets (trees), and Power BI dashboards covered with the Financial Reports feature, but you can also utilize a data warehouse or other Excel-based reporting solutions available as ISV products separate from Business Central (much like GP has).

Comparing GP to BC Reporting
I propose we use a “reporting-type” framework for this, and move through the products after that. From inside my Dynamics GP mindset, I offer the following reporting types and groupings for discussion points:
Standard Operational GP Reports
Typically module-specific: Inventory, Payroll/HR, Manufacturing, Project, Sales, Purchasing, Service
Often run on-demand for cumulative, or sometimes periodic analysis
External-Facing Documents
Sales (Sales Order, Invoice, Return)
Purchasing (AP Check, Purchase Order)
Standard Financial GP Reports
GL Trial Balances
Summary
Detail
Advanced Financial Analysis
Subledger Reports
Fixed Assets (depreciation roll-forward)
Payables (aged trial balance; aging)
Receivables (aged trial balance; aging)
Inventory (inventory stock status; item transaction history)
Excel-Linked Reports
GP Excel-linked report deployment
Custom refreshable Excel-linked reports or queries
SSRS Reports
GP-deployed SRS reports
Custom SRS reports
ODATA
GP-deployed ODATA endpoints
SmartLists
SmartLists are definitely everyone’s favorite!
Management Reporter
Income Statement
Balance Sheet
Cash Flow Statement
Power BI Reports and Dashboards
Data Warehousing or ISV reporting solutions

Dynamics GP Reporting
Report Writer for GP
Once you have used GP long enough, you understand one of the weakest links in the whole product is the Reports.dic file. When Report Writer is used to open and modify a report, a modified version of the original report will be created (or edited). The dictionary files contain all of the modifications to all of the GP reports your people use. Let’s just say for now it is overly sensitive to change without having exclusive access. Thankfully it is easy to back up both individual reports or all of the reports at any time to a .package file to ensure you have a recoverable copy just in case the original becomes corrupt. Business Central has a similar approach to backing up or importing report layout files, but they are the actual .rdlc or .docx report design files, not an .xml facsimile (e.g package file). More on this later.

Customer/Vendor-facing formatted Documents
Dynamics GP has a lot of versions of various forms that should look good when printed in GP. In the Sales series, it offers a Blank, Short, Long, and Other form layouts which allows flexibility when printing for different transactions or batches. For Purchasing, it has Blank and Other forms. Vendor Checks need to align fields correctly regardless of the layout you are using (text or graphical, and check vs stub position). Of course Business Central has all of these important forms, but the layouts look very different than GP and are not modified in the same way, or with the same tools.

Word Template Reports
These were developed as enhancements to the Report Writer reports, and are used to send as attachments to emails. They represent the Report Writer layouts, but with the ability to fine-tune in a variety of ways within Word and for individual customers in Dynamics GP, providing a precise layout delivered to specific customers or vendors. BC has embraced the Word Template approach and they are easier to work with than their GP counterparts.
SmartList Reports
SmartLists are by far the most widely used reporting tool in GP, because they can quickly find, filter, and export data to Excel for additional analysis if needed. They do not natively provide groupings or subtotals, however Business Central offers a lot of this capability natively and is something to look forward to for your GP users!
Management Reporter Reports
I have always loved the concept that FRx and MR used which is ROW + COLULMN + TREE = Many Reports! MR is a ROBUST and easy to use GL financial reporting tool and it suits the reporting on general ledger segments very well. This intuitive reporting approach is embodied inside BC as a combination of Financial Reports and Analysis Reports. Not exactly the same, but that’s because the general ledger between GP and BC is different!
Excel-Linked Reports
One of the fastest ways to get GP data into Excel us by using Excel refreshable reports. There are some really great things you can do with these. For example, you can execute a SQL query in record time against the database, or prepare a set of report-dependent dashboards which automatically refresh as well. Rest assured, Business Central has a lot of similar rapid-export capability as well, however the Excel AddIn is really used to push data from Excel into BC. This is a highly-technical topic, and worthy of its own post someday, so watch for it!

SQL Reporting Services Reports
Many customers have, but don’t actively use the SRS reports you can deploy from within GP. I always put them out there as a best practice, but truth is, awareness is a big issue. It takes a concerted effort get users to adopt SRS reports, but once they do, they tend to love them. The advantage is we have better control over them than Report Writer does, and we can much more cleanly export the data from the report to Excel.
Power BI Reports
Dynamics GP resides on a SQL Server database platform, so your Power BI reports will be utilizing a SQL connection. If they have been published to the cloud on the Power BI service, then the Enterprise Gateway service will provide cloud connectivity to the GP on-prem ERP data.
External / ISV Data Warehousing
There are countless ISV reporting solutions residing outside of Dynamics GP. They all connect to GP SQL, or have a copy of the GP SQL data in a warehouse of some kind in order to perform their reporting functions. This data warehousing method also exists for Dynamics Business Central and also has a thriving ISV community. The discussion of products outside of BC is not the focus of this post.

Dynamics 365 Business Central Reporting
Report Writing for BC
There are three primary types of report layouts in BC; Excel, Word Templates and RDLC files. Each has its strengths and weaknesses, and the technical ability required to master each reporting tool is quite different. The Word Template (*.docx) files are the easier of the types to modify. They have embedded connections to BC which offer data fields for selection and placement on the page. RDLC files require SQL Server Report Builder or Microsoft RDLC Report Designer to enhance or modify, and the data fields are a bit tricky to get a handle on, and therefore sometimes require some trial and error to get right.
Report Layouts
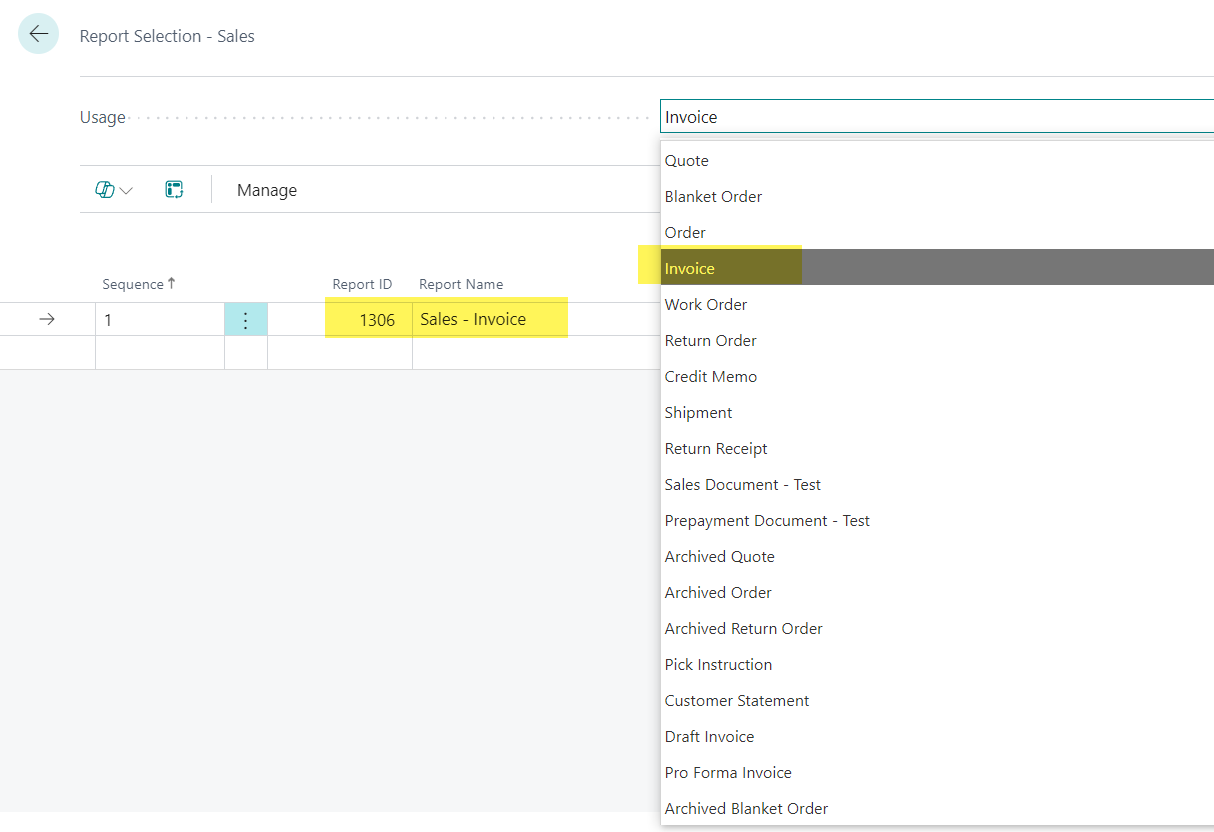
The master listing all of the report designs in BC can be found on the Report Layouts page. There are over 600 report layouts available which come out of the box. Of those, 559 are RDLC, and 42 are Word Templates (these numbers will change over time). The balance are Excel report layouts which were mostly introduced in the wave 1 2024 release. In the example below, I searched for all “Sales -” documents and then highlighted what would likely be the two choices you would look at first to see how your Sales Invoices in BC appear without any modifications. Naturally these can be customized, and new ones can be added. You can see there are 5 OOB choices for Sales Invoices, all with Report ID 1306. To me these should all be different IDs, but the Default checkbox indicates the layout selected for your environment.

Customer/Vendor-facing formatted Documents
Each functional series has a set of reports that are used as defaults. I think BC does a good job of offering a simple setup for assigning the default outward-facing report layouts in the Report Selection area.

Report Selection
One of the key setups in Business Central is identifying the default layout for each type of report. As an example, in the Sales area, I would recommend creating some example transactions for Sales Orders, Draft Invoices, Sales Invoices, Sales Returns, Credit Memos, Reminders, Statements and any other type of customer-facing document you need, and printing all of the OOB layouts to find the best one for you to start with. Then set that ID and report type (Word template or RDLC) as the default for each category of report (usage). You will probably discover the need to customize the layout to make it exactly perfect for your needs.
Company Logo
One nice advantage Business Central has is the ability to apply a company logo in one spot and then the customer-facing documents automatically pick up that image or logo. Other report writers require every report to have the logo placed, but with BC, simply load your image in the Company Information page and that’s it - your invoices will print your professional image in full color at the top of the page. In following the new features, I understand that the 2024 Wave 2 release now has logos printing on Purchase Orders too.


Custom Report Layouts
Of course you can have your own custom layouts in Business Central - and you will! This process is similar to Dynamics GP; the original layouts stay put. If you make changes, you do so inside a copy of the original. When you craft your own custom report layout, you can choose which report writer, or file type, you want to use. Just know that making changes in the Word Layout does not automatically inflict change in the RDLC layout. They are completely separate from each other. I find this approach to BC reporting more flexible than GP, because you can actually have multiple copies of the same sales invoice report available in the system, which is really helpful for testing report changes and rolling out new ones (in other words, you aren’t going to corrupt the Reports.dic file like you can with Dynamics GP!)

Maintaining Custom Report Layouts is fairly straightforward, and the Import/Export action offers the capability to externally back up your report, or create layout export files for transfer between companies or environments (e.g. promoting from Sandbox to Production).

List Pages (SmartLists)
I think the List Pages are the 2nd coolest thing overall about Business Central (the first is Dimensions, in case you are wondering). Also see the GP to BC comparison post on this topic for a deep-dive. No sense in repeating here what has already been said!
Financial Statements
It is incredibly rare that I see a GP user who relies on the baked-in financial statements (aka AFA). Report Writer just flat out stinks to use, so just about everyone uses Management Reporter for financials. There are also plenty of external reporting products and methods available, but that’s not important here. I want customers who are migrating from Dynamics GP to BC to completely rethink their reporting needs, especially with respect to financial statements, and here are 7 reasons why:
1. You need to validate whatever amount of GL history you bring over from GP to BC, and creating the financial statements in BC helps get that done. It is a great time to learn about the capabilities of the financial reporting elements, and create some lasting reports you will rely on long after you go live.
2. Microsoft did not make MR work for BC, although personally I think it would be awesome to see that happen.
3. Users can set up their Favorite Accounts on their home page, perhaps eliminating the need to even have a report.

4. The Chart of Accounts page serves as a dynamic trial balance. It can be saved with various filters, giving you a quick view of your GL account activity without even running a report in the traditional sense.

5. The Financial Reports have gotten some good attention in Business Central and they are designed with the familiar Row/Column concept. You then natively have the Dimension concept in BC, so spreading dimensions across columns, grouping/summarizing dimension values, and extracting financial activity using dimension combinations in a variety of layouts is very much the norm. You’ll end up with summary and detail Balance Sheets, Income Statements, Cash Flows, etc. just like you have in Management Reporter, all within BC.

The Financial Statement Rows can be imported from the Chart of Accounts, and you can dial in from there, depending on the report you are writing.

The Financial Statement Columns allow for flexibility in placing actuals and budgets on the page, and determining any variance or percentage calculations that need to also be present.

6. Analysis Views are super flexible, and become the basis for how dimensions are grouped, similar to the Reporting Tree in Management Reporter. These can be applied to an entire financial report, or only rows, or only columns, which offers design capabilities which group and summarize and present financial information in a clean, printable and exportable end product.

7. The Financial Reports can be viewed first on-screen, where the parameters can be changed and the report re-run if necessary. If can be previewed, printed to PDF, or even exported to Excel.

As you can see below, the end product really does look good on-screen and in-print, and it exports to Excel well. The OOB reporting should solve the financial statement requirements for most organizations. If you need to perform consolidation or currency translation, look for future comparison posts dedicated to multicurrency and consolidation reporting!

Excel Reports
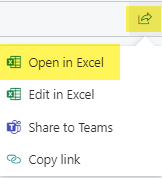
First of all, Excel is probably the default reporting output for MOST of your Business Central reporting, overall. You can export data from the various pages to Excel, run a report and choose to export to Excel, and there are some incredible baked-in Excel reports you can rely on. Of course there is also the Edit in Excel functionality for BC that can be really helpful at times, but that is not what the focus is here. Let’s cover a few Excel reporting highlights I believe are worth knowing about as you and your team transition from GP to BC.
I encourage you to refer to a previous post about comparing GP SmartLists to BC Pages for a deeper dive on exporting from List Pages to Excel, and using Analysis Views on List pages. Thankfully the Export button is clear and consistently displayed on all of the right pages.
EVERY GP USER WILL JUMP FOR JOY knowing more than one of the standard Print Dialog options are Excel-based! Exporting GP reports to Excel was awful. BC is way better in this department, so you have a lot to look forward to.

There are 35 new Excel-Downloadable Reports designed to optimize and enhance the overall reporting experience for BC users. The preview (sneak-peek) ones appear below, but more are coming! Note the that in the print dialog box for these Excel reports there is no ‘report preview’ function; they download straight to your Downloads folder, where you can then open, review and analyze the information interactively.

When generating the Excel downloadable reports, set the parameters and filters you need first, then click Download.

Of course you can print these reports too, directly from Excel, but their real power lies in the embedded nature of the reports. Change the values in the pivots, and the data in the report reacts, enabling the user not only report on things, but really analyze the data in a meaningful way!

How do these reports have such superpowers? If you notice at the bottom of this image there are multiple tabs, instead of just a single report page. The other pages include the data used in the report itself! You can explore the other worksheet tabs, and see data that you might wish to explore or analyze further.


Power BI Reports
GP had previously created an ODATA endpoint service and it works OK-ish, but BC uses ODATA extensively because it is natively a web-based application and it really needs to rely on a service.
Very early-on in my BC journey I studied how to connect to BC as a data source, and ultimately have now used Power BI for all types of reporting. This is my favorite thing to present on and introduce users to at conferences as well. For a GP user making the move to BC, the hardest thing to handle is creating, testing, and deploying custom queries, but Microsoft is making improvements in this area. Nonetheless, the standard Web Services have been the way to go for Power BI reporting, with a growing reliance on API endpoints as well.
BC initially comes with a number of active endpoints to get data from, but you quickly learn in order to be truly effective at Power BI reporting in BC, you need to take the time to create and expose a bunch of hidden endpoints, which in reality, should already be there but aren’t. You will come to the point using Power BI on your own where you need a developer to create custom endpoints that you can’t expose as a ‘citizen developer.’ It’s not the end of the world, but know some technical assistance will probably be needed with BC, similar to people who created custom SQL views for GP reporting.

Connecting from Power BI Desktop to Business Central is straightforward and simple. There is a dedicated Online Service Business Central Data Source option that allows you to connect to either your Production or Sandbox environments, and then to a specific BC Company for reporting on. Once your data sources are in the model, it can refresh directly against Business Central.

A Workspace in the Power BI Service is where your reports are shared out to other users. With Dynamics GP, you needed the Enterprise Gateway to connect GP to the reports published on the Service. With Dynamics BC, you do not need that piece of infrastructure because BC is already in the cloud and does not need a middleman to connect to your on-prem data.
The Role Center home page is a great place to pin some Power BI dashboards for end users to consume within Business Central. You can pin more than one report, and also cycle thru the various pages within a report.

The most exciting thing for me about the timing of this post, is the release of around 70 new Power BI reports in wave 2 2024. These Power BI Template Apps for your Business Central data are optional and free to use. Microsoft has invested heavily in creating sophisticated and out of the box dashboards to enhance the reporting experience dramatically. Game changer alert. I will be creating a separate post about deploying and using these next month - they are currently brand new, and deserve separate attention so we can help users get the most of them!


There are two Telemetry Power BI Apps available for BC worth noting as well. When you transition to BC, you lose access to SQL Server, and the Windows operating system, the server itself, and the network monitoring you were used to. It’s weird at first, because you can’t ‘see’ anything about what’s going on in the ERP environment. As a longtime GP system admin, this was unnerving but ultimately I found and dug into the Telemetry (Usage) Power BI apps for BC. This was revolutionary for me personally, and I consider myself an evangelist for this now, speaking frequently at conferences about how it can be used effectively to optimize and troubleshoot your Business Central environment without direct access to the server.

External / ISV Data Warehousing
There are a growing number of software vendors in the BC space that offer some form or ‘OUTSIDE THE BOX’ financial or analytical reporting. The same is true for GP as well. Some of the same vendors have data warehousing and analytics solutions for both GP and BC, so there is a decent chance you may be working with a vendor now who also has a BC-equivalent solution. Since you really can’t get at SQL with BC, it has been a task of mine to spend time with many different vendors and uncover how they provide solutions at Summit, DynamicsCon, and Directions. Rest assured, there is no shortage of other places to spend your money, energy and time, but in all reality, Business Central just ‘OUT OF THE BOX’ for reporting is fantastic. It also makes you rethink what’s important about reporting in your organization.
I’m grateful should this experience or these insights be helpful to you on your journey…until next post!